


Understanding the SpotOn Turf Moisture Meter
The SpotOn Turf Moisture Meter is a portable, digital probe
designed for turf professionals, such as golf course superintendents, landscapers, and sports field managers. It measures three key parameters: soil moisture (as volumetric water content, or VWC), electrical conductivity (EC for
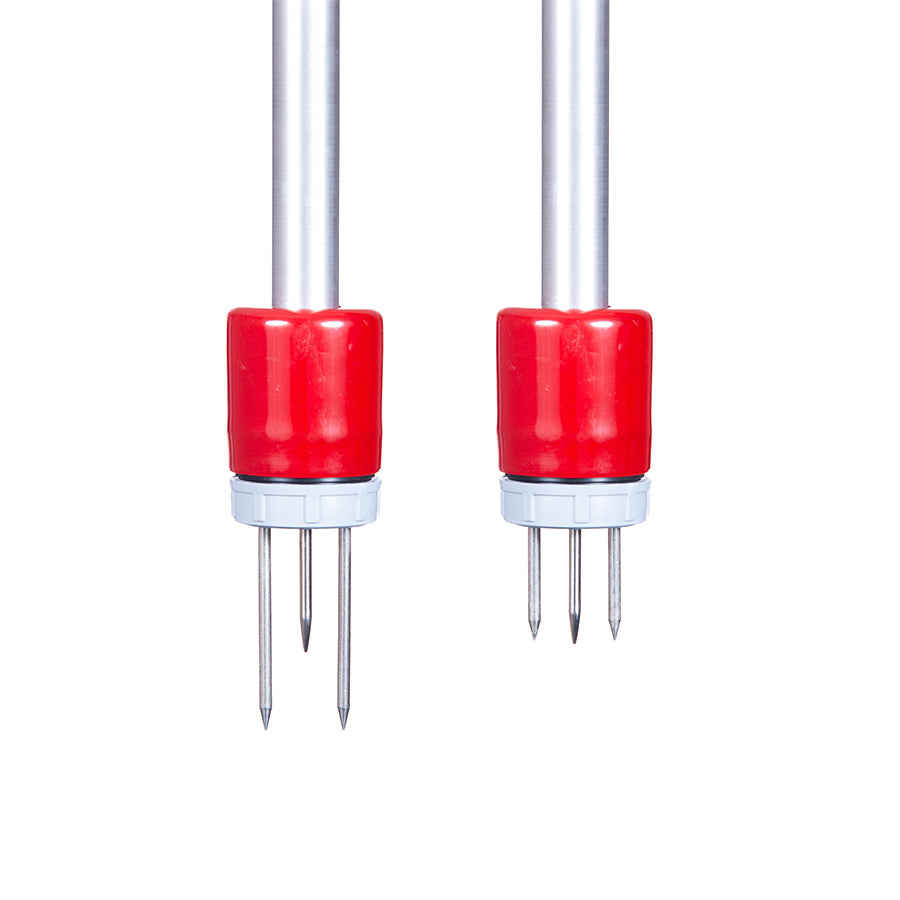
salinity), and soil surface temperature. Readings are displayed continuously on a digital screen—no button presses needed during testing. The device uses replaceable rods (2.375" or 1.5" depths) and is calibrated for accuracy across various soil types and salinity levels using a 100 MHz ultra-high-frequency circuit.
The meter is IP64-rated (dust- and rain-proof) and runs on 3
AA batteries for up to 300 hours. Always clean the rods after use and store with the protective cap on to maintain accuracy.
How to Take Readings
Power On: Press the power button. The display shows the rod
length (switch between 2.375" or 1.5" using the AVG button if
needed).
Insert Rods: Push the rubber-mounted rods fully into the
soil at your desired depth, ensuring good contact. Avoid rocky or compacted areas that could bend the rods.
Read Values: The screen shows:
Moisture (0.0–100.0% VWC).
EC (0.0–5.00 mS/cm).
Temperature (16°F to 120°F / -9°C to 49°C).
Average Readings: Use the AVG button to calculate and clear
averages for multiple spots.
Best Practices: Take multiple readings (e.g., in a grid
pattern) across areas like greens, tees, or fairways. Test after irrigation or in problem spots (high/low areas). The device auto-shuts off after 20 minutes of inactivity.
Interpreting Moisture Readings
Moisture readings are given as volumetric water content
(VWC) in percent (%), representing the volume of water relative to the total soil volume. Unlike reference scales (0–100 arbitrary units), this is a quantitative measure, but interpretation is relative to your specific soil type and site. Soils vary in texture, compaction, and composition, so absolute numbers differ—e.g., sandy soils hold less water than clay. Do not compare
readings directly between different soils or locations without calibration.
Step-by-Step Correlation for Your Site
To interpret readings meaningfully, establish baseline
"ranges" for your turf areas (e.g., separate for greens, tees,
fairways, or athletic field zones with different soil builds). This process, called correlating readings, should be done once per area and remains stable unless you renovate the soil.
Determine "Wet" (Field Capacity):
Fully saturate the soil via irrigation.
Allow it to drain and soak in (typically 1–2 hours, until no
free water remains).
Insert the meter and record the reading—this is your
high-end "Wet" value (e.g., might be 30–50% VWC in a loamy green, but test yours).
Field capacity is the ideal post-drainage moisture where
roots can access water without saturation stress.
Determine "Dry" (Low End):
Test in a visibly dry area (e.g., after extended dry
weather, before wilting occurs).
Record this as your low-end "Dry" value (e.g.,
might be 5–15% VWC).
Define "Good" (Optimal Range):
Set your target between "Wet" and "Dry,"
typically 60–80% of the span from Dry to Wet.
Example: If Dry = 10% and Wet = 40%, Good might be 22–32%.
Adjust based on turf species, weather, and goals (e.g.,
bentgrass greens prefer 20–30% VWC for playability).
Once set, use these ranges daily:
Wet (> Your Wet threshold, e.g., >40%): Soil is
over-saturated; risk of root rot, black layer, or poor playability. Reduce irrigation and aerate if needed.
Good (Within your target, e.g., 22–32%): Optimal for turf
health, growth, and performance. Maintain with targeted watering.
Dry (< Your Dry threshold, e.g., <10%): Soil is
stressed; irrigate soon to prevent wilting or dormancy. Monitor for hot spots.
Status
Typical VWC Range (Example for Loamy Turf Soil)
Management action
Wet>35–50%Hold off watering; improve drainage if chronic.
Good20–35%Monitor; irrigate lightly if trending down.
Dry<15–20%Irrigate to field capacity; check uniformity.
Note: These are illustrative examples—your values will vary.
Track trends over time (e.g., via app export if using the Bluetooth Pocket version) to refine thresholds. For golf greens, aim for uniformity within 5% across the surface.
Interpreting EC (Salinity) Readings
EC measures soil salinity in milliSiemens per centimeter
(mS/cm), indicating salt buildup from irrigation or fertilizers. Higher EC can stress turf, causing burn or poor growth.
Low (<1.0 mS/cm): Ideal; low salt risk.
Moderate (1.0–2.5 mS/cm): Monitor; common in turf with
moderate fertilizer use.
High (>2.5 mS/cm): Potential stress; leach with low-EC
water (e.g., rainwater) to flush salts.
Benchmark your baseline after leaching events. No
site-specific correlation is needed, but test post-fertilization or in
saline-prone areas (e.g., coastal sites).
Interpreting Temperature Readings
Surface temperature is shown in °F or °C. Use it for timing
applications:
Cool (Below 50°F / 10°C): Slow growth; delay nitrogen apps.
Optimal (60–85°F / 15–29°C): Peak turf activity; ideal for
most cultural practices.
Hot (Above 90°F / 32°C): Heat stress risk; increase shade or
evening watering.
Combine with moisture: High temps + low moisture = urgent
irrigation need.
Tips for professionals
Trends Over Absolutes: Focus on changes (e.g., dropping 5%
VWC signals dry-down) rather than single readings.
Factors Affecting Readings: Soil salinity can slightly
influence moisture accuracy—recalibrate if EC spikes. Avoid testing in standing water or frozen soil.
Integration: Pair with visual cues (e.g., footprinting for
compaction) and weather data for holistic decisions. For events/tournaments,
test high-traffic areas pre-play.
Maintenance: Verify accuracy annually; replace rods if bent.
Watch the demo video on YouTube (search "SpotOn Turf Moisture Meter") for visuals.
For the full product manual, visit Innoquest's site or
contact their support. If your readings seem off, it could indicate calibration needs or soil changes—re-correlate as needed. This tool excels at preventing over/under-watering, saving resources while boosting turf vigour.